- Click the “Reports” module from the left navigation menu and select “Reports” (beta). This will direct you to the Reports builder home page, where you can view all previously created reports.
-
Click the + Create New Report button in the top-right corner of the Reports home page.
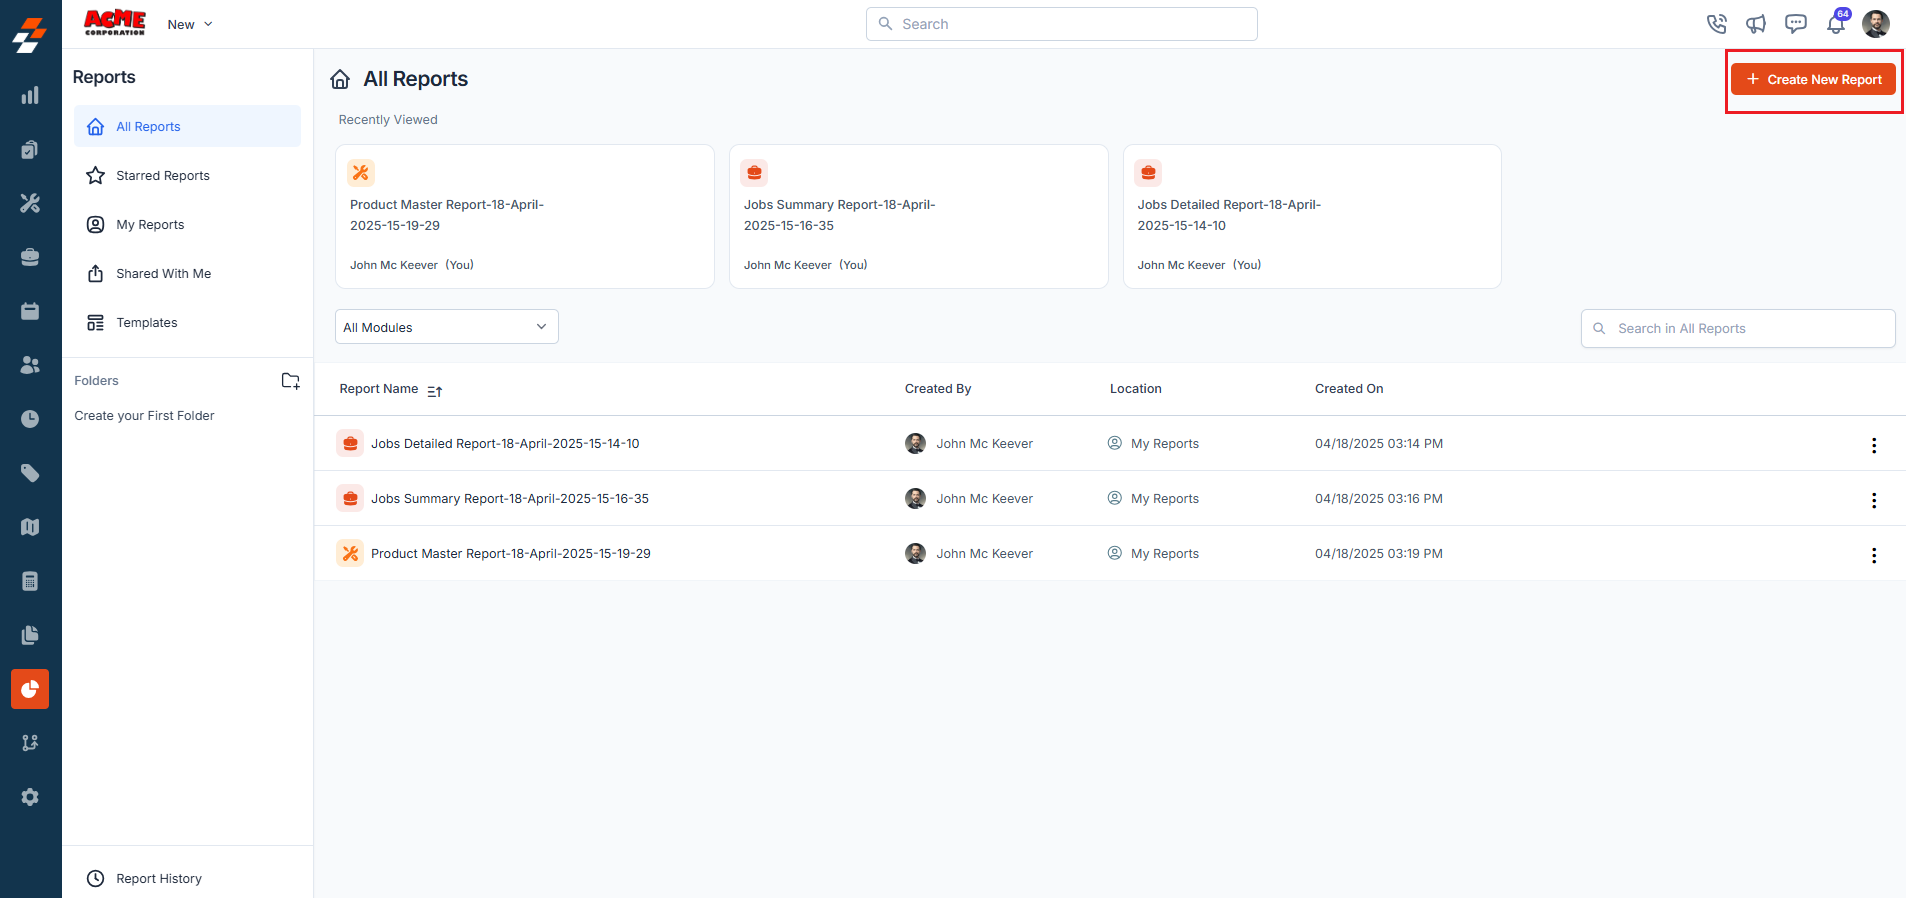
- A pop-up will appear.
-
Choose Detailed Report from the available options.
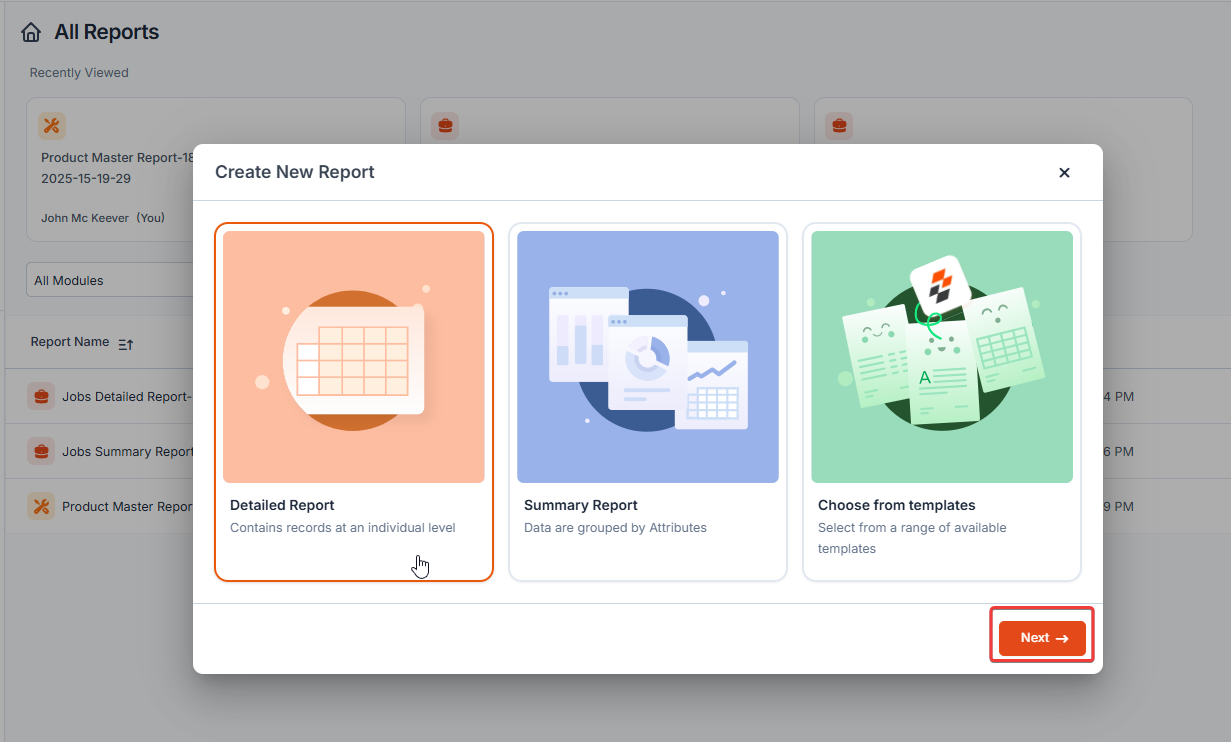
- Click Next to proceed.
-
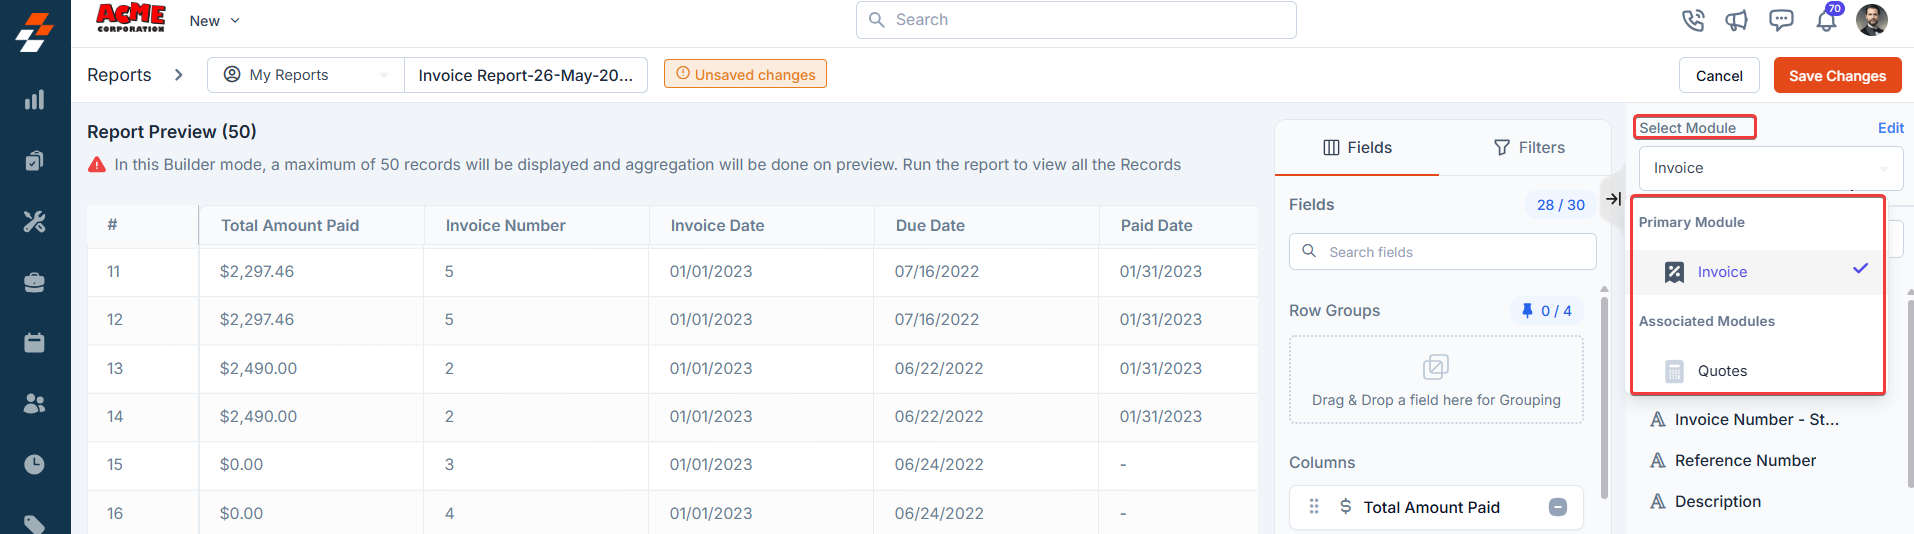
After selecting the Detailed Report, you will be prompted to choose the Primary Module on which you want to focus your report (e.g., Jobs) and click Next.
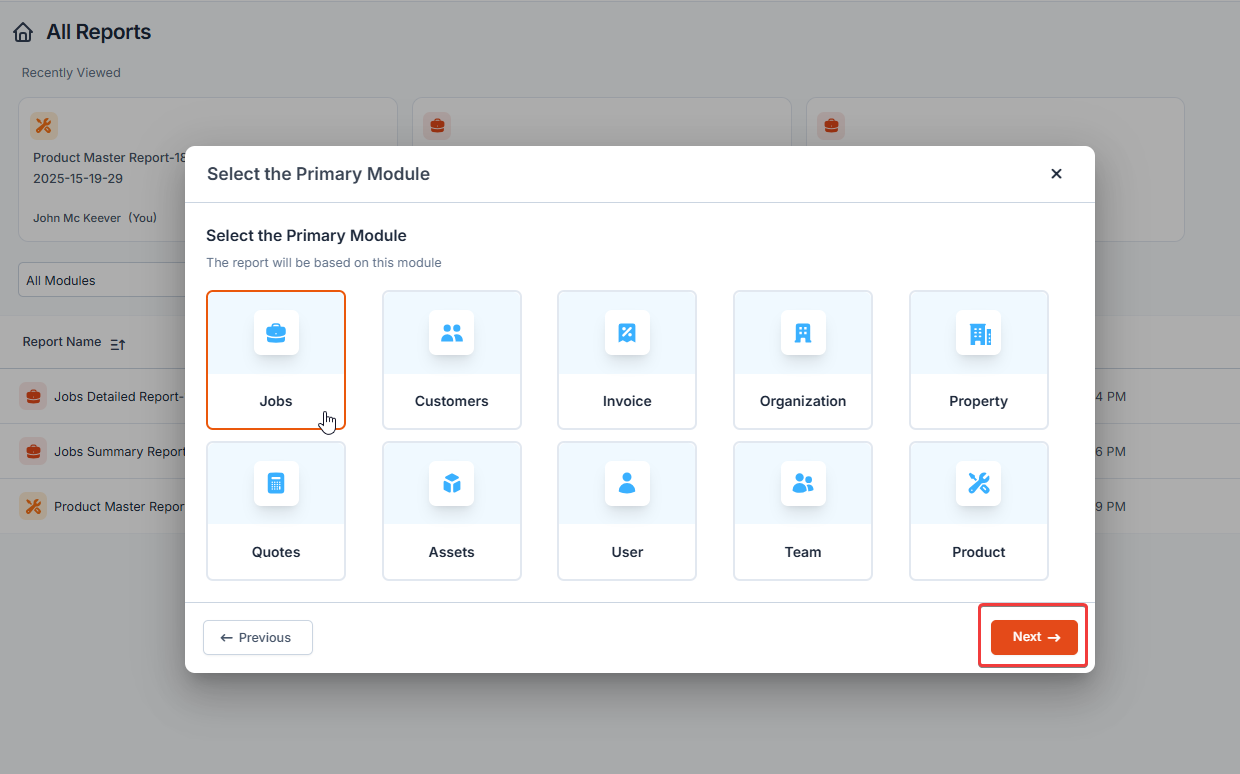 Note: The primary module determines the main data source that will be included in the report.
 -
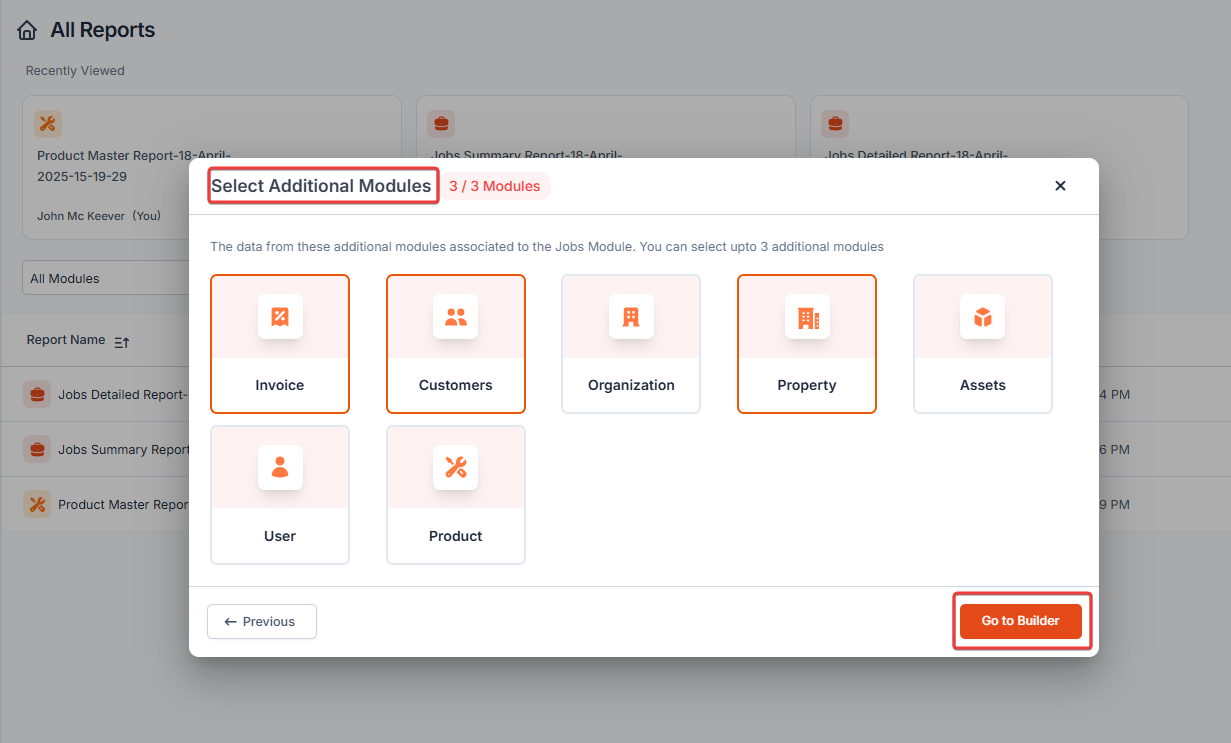
Select the additional modules you need. You can select up to 3 additional modules. Zuper allows you to pull in the fields’ data from Additional Modules associated with your primary module. This optional step helps you to create comprehensive reports by combining related data from various modules of your account/company.
Understanding Primary and Associated Modules in Zuper Report Builder
You’re about to build a report in Zuper, and you’re thinking, “Where do I start?” The answer lies in choosing the right modules, and understanding the difference between a Primary Module and Associated Modules is the first step toward creating reports that truly work for you. Let’s walk through it together. Meet the Primary Module: Your Report’s Backbone Here, the Primary Module is the foundation of your report. It sets the stage and decides the “main character” for each row of data. If you want to build a report that shows a list of customers, then “Customer” should be your Primary Module. If you’re more interested in seeing job progress, then “Jobs” might be a better fit. Whatever you choose here becomes the center of attention. Introducing Associated Modules: Supporting Cast with Valuable Details Now that you’ve set your stage with a Primary Module, it’s time to bring in some supporting roles. Associated Modules are additional sources that provide related details without changing the number of rows in your report. They’re optional, but incredibly helpful. You can add up to three associated modules to pull in extra information, like the number of jobs linked to each customer or the total invoice value associated with a job. Scene 1: You’re Reporting on Customers You want to see a list of all your customers and how many jobs each one has. So, you choose: Primary Module: Customer Associated Module: Jobs Your report might look like this:Customer Name Number of Jobs Alpha Corp 2 Beta LLC 1 Gamma Inc - Notice something? Even Gamma Inc., which hasn’t had any jobs yet, is included. Why? Because your report revolves around customers, that’s your Primary Module. Scene 2: Now You’re Focused on Jobs This time, you’re interested in tracking job statuses and who they belong to. So, you switch it up: Primary Module: Jobs Associated Module: Customer Now your report looks like this: Job ID Status Customer Name :— :— :— JOB101 Completed Alpha Corp JOB102 In Progress Alpha Corp JOB103 Completed Beta LLC Here, only jobs are shown. Gamma Inc isn’t listed anymore because they don’t have any jobs, and the report is all about jobs this time. - Click Go to Builder.
-
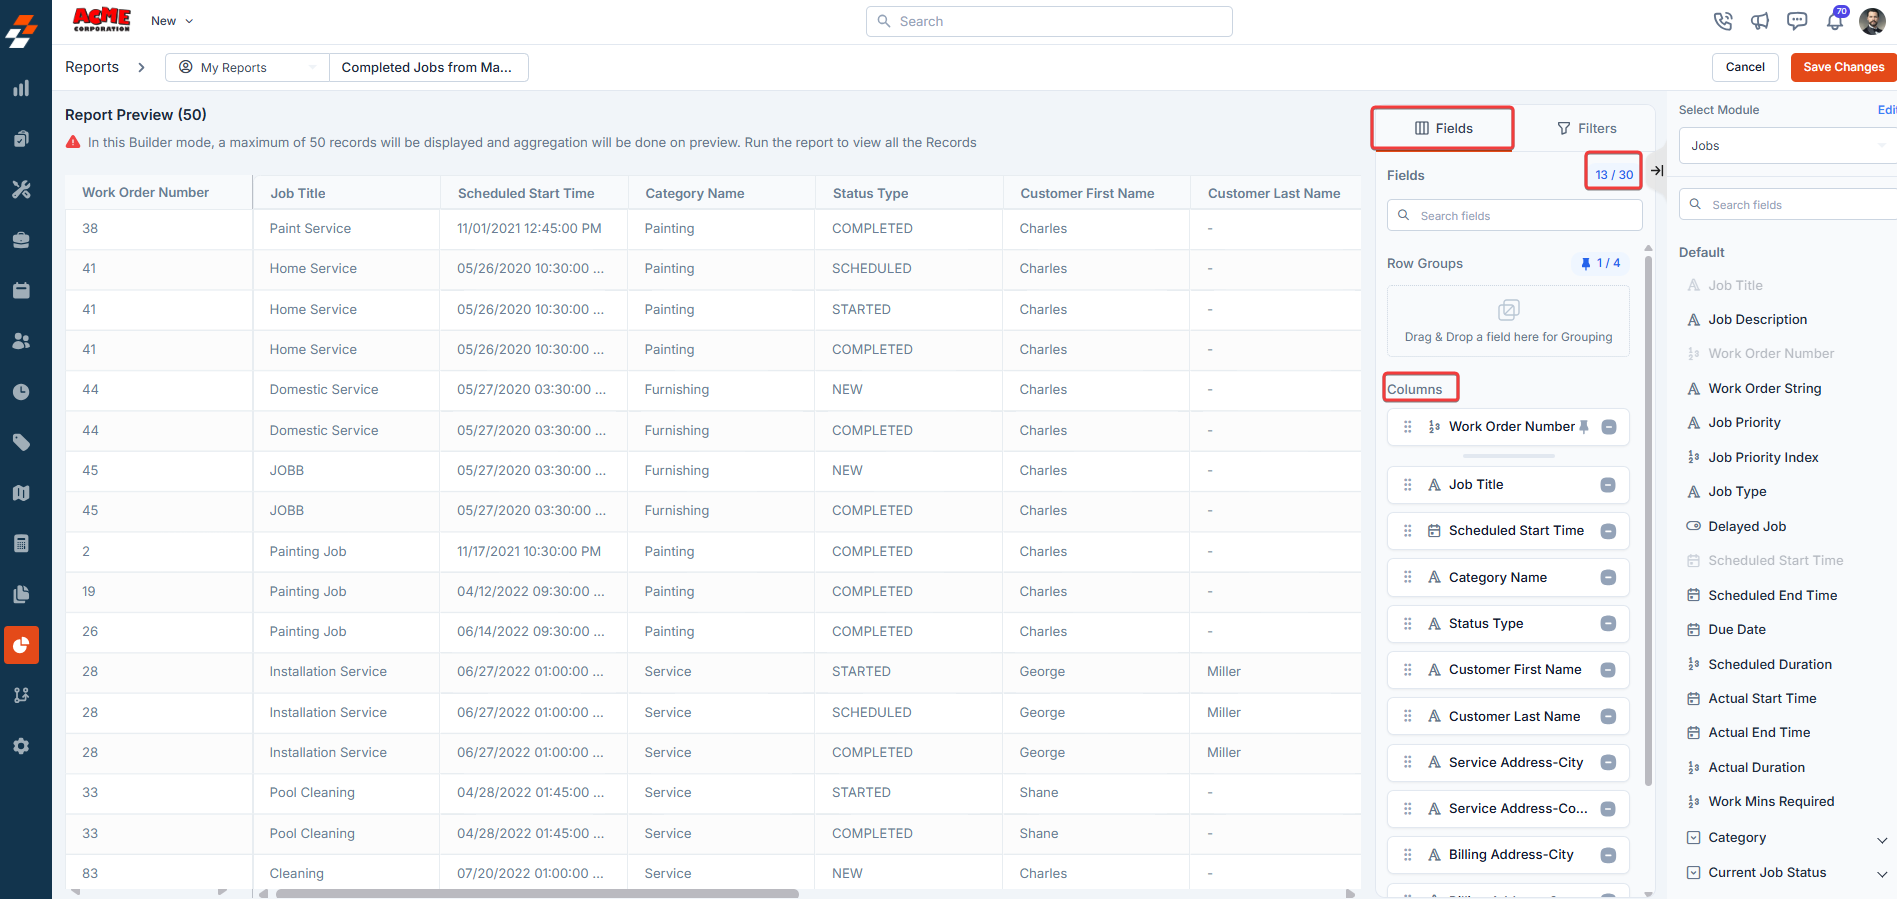
Once the report creation page opens, you can start defining the fields to be included in the report.
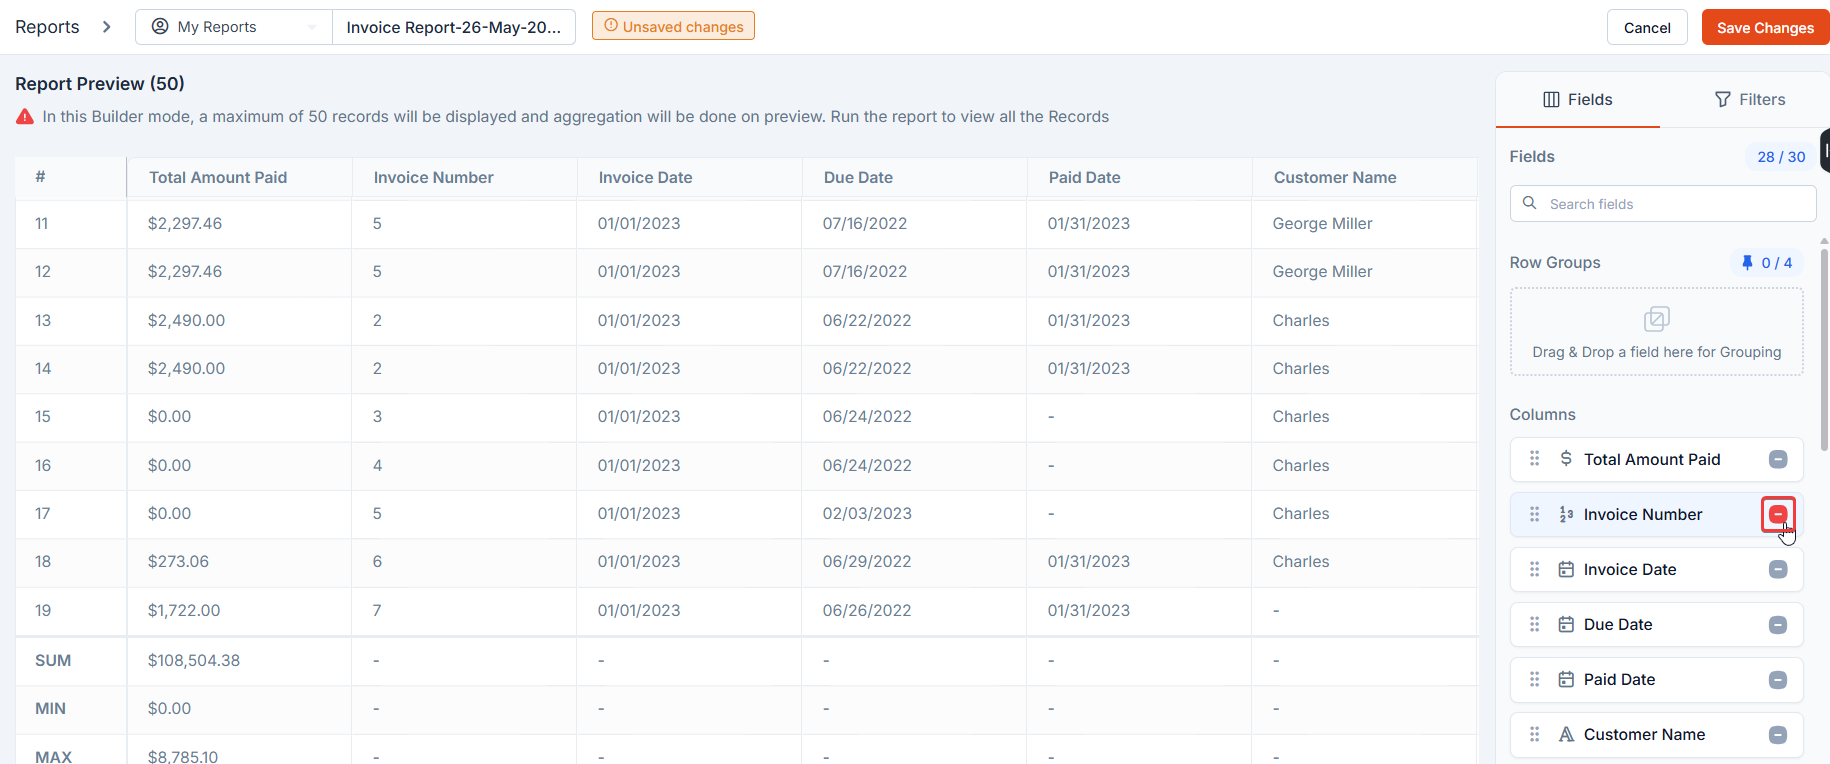
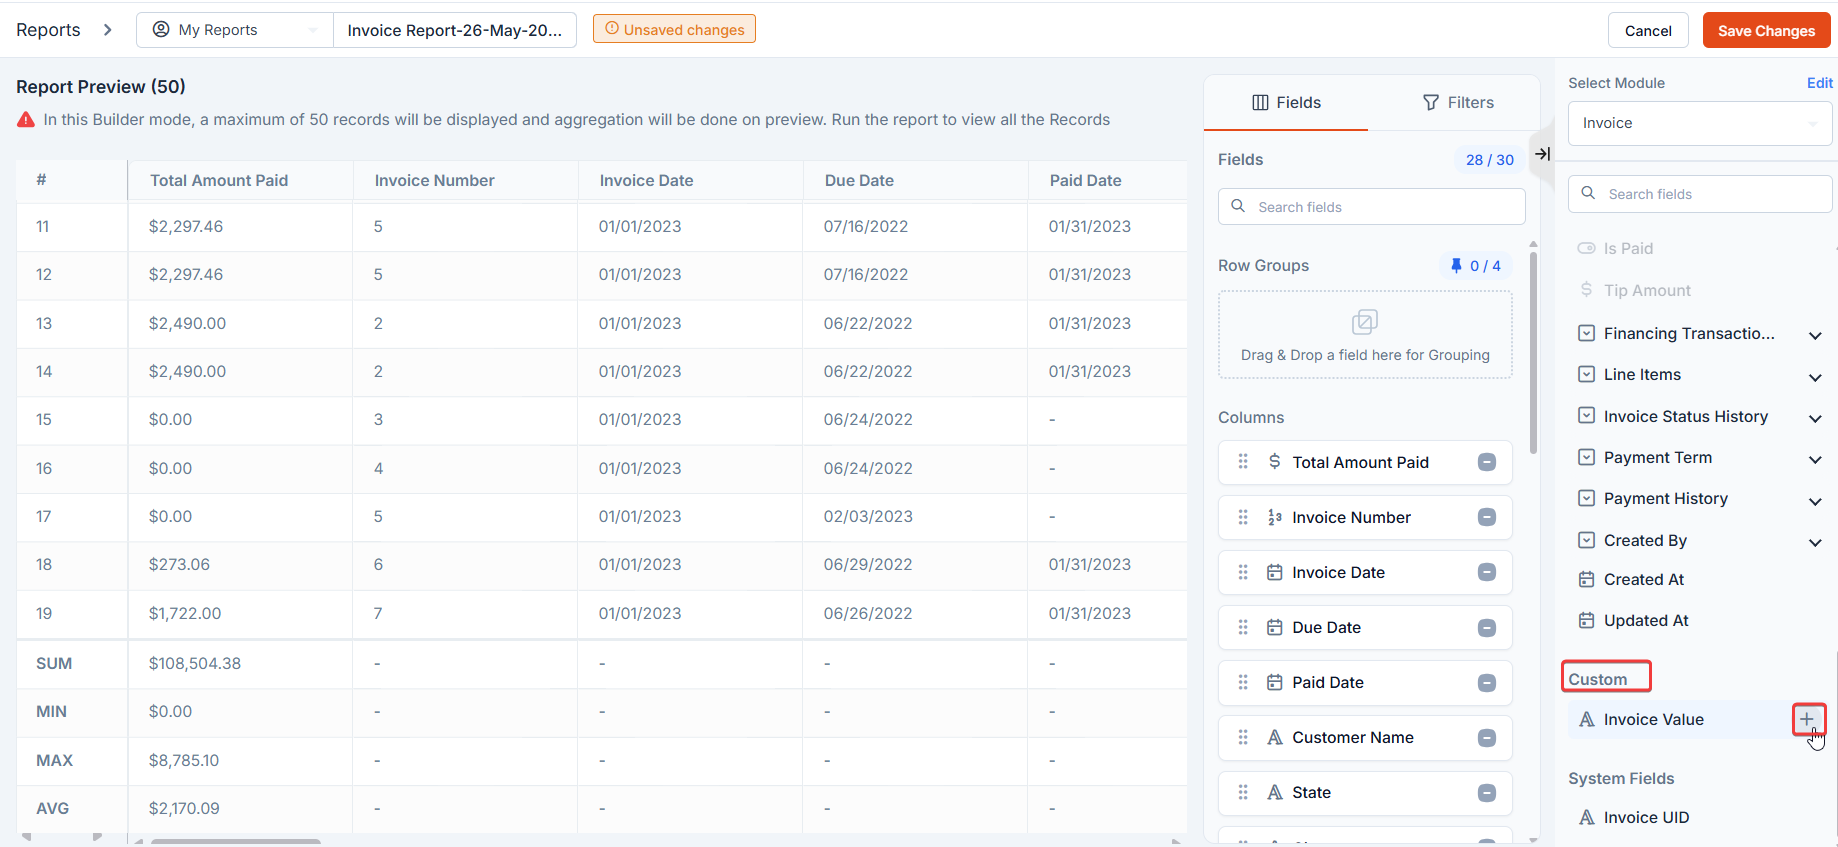
- Fields selection for row and column grouping: A list of all available fields (including Defaults, Custom, and _System _fields) from the selected modules will be displayed in the Available Fields panel. You can choose the relevant fields that should appear in your report, such as Job Title, Invoice Date, Technician Name, etc., according to your preferences. Use the “+” icon or drag and drop to add the fields you want to include in your report. You can include up to 30 columns in a detailed report.
 Note: You can reselect the modules by clicking the Edit button. However, updating the modules will reset the report.
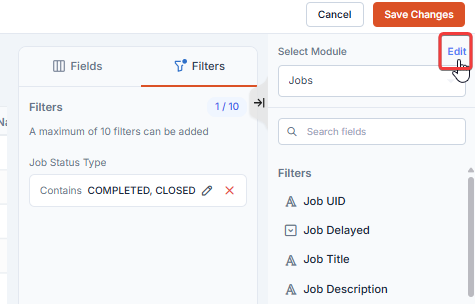
- Customize column: You can rename column names and customize how each column behaves within the report. To know more, see Configure Report Settings.
- Fields selection for row and column grouping: A list of all available fields (including Defaults, Custom, and _System _fields) from the selected modules will be displayed in the Available Fields panel. You can choose the relevant fields that should appear in your report, such as Job Title, Invoice Date, Technician Name, etc., according to your preferences. Use the “+” icon or drag and drop to add the fields you want to include in your report. You can include up to 30 columns in a detailed report.
-
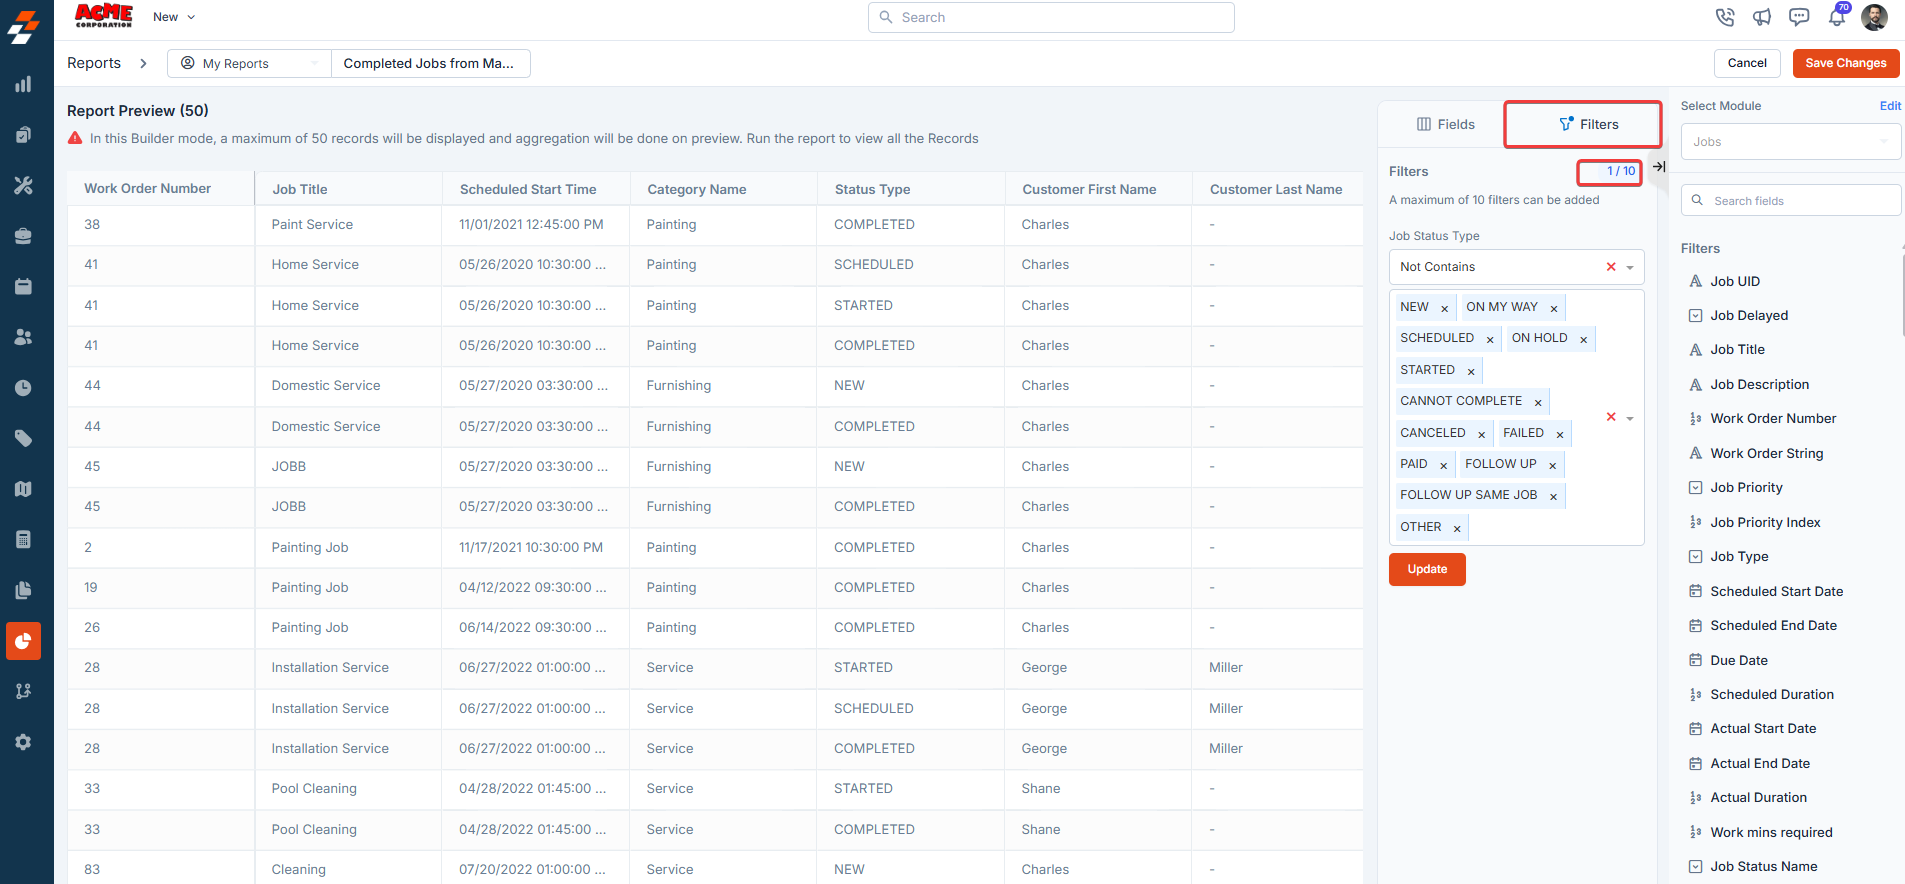
After selecting your fields, click Filter tab > Add Filter to filter the report based on various attributes. For example, if you only want to see jobs completed within the last month or invoices over a specific amount, you can add those filters. Note that you can use up to 10 filters to refine your data.
-
Set a Title to save the newly created detailed report.
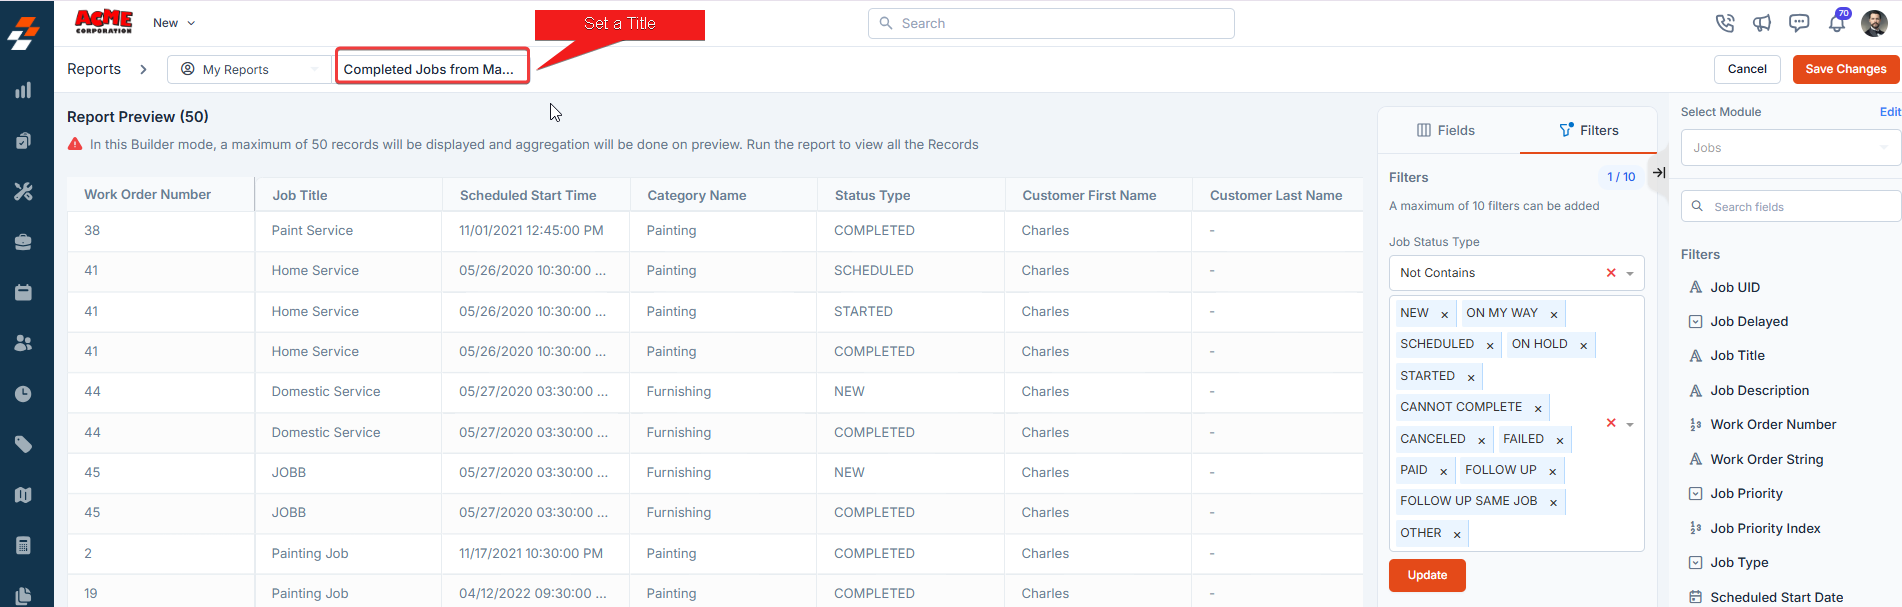 Note: The maximum allowed length for a report name is 50 characters.
 -
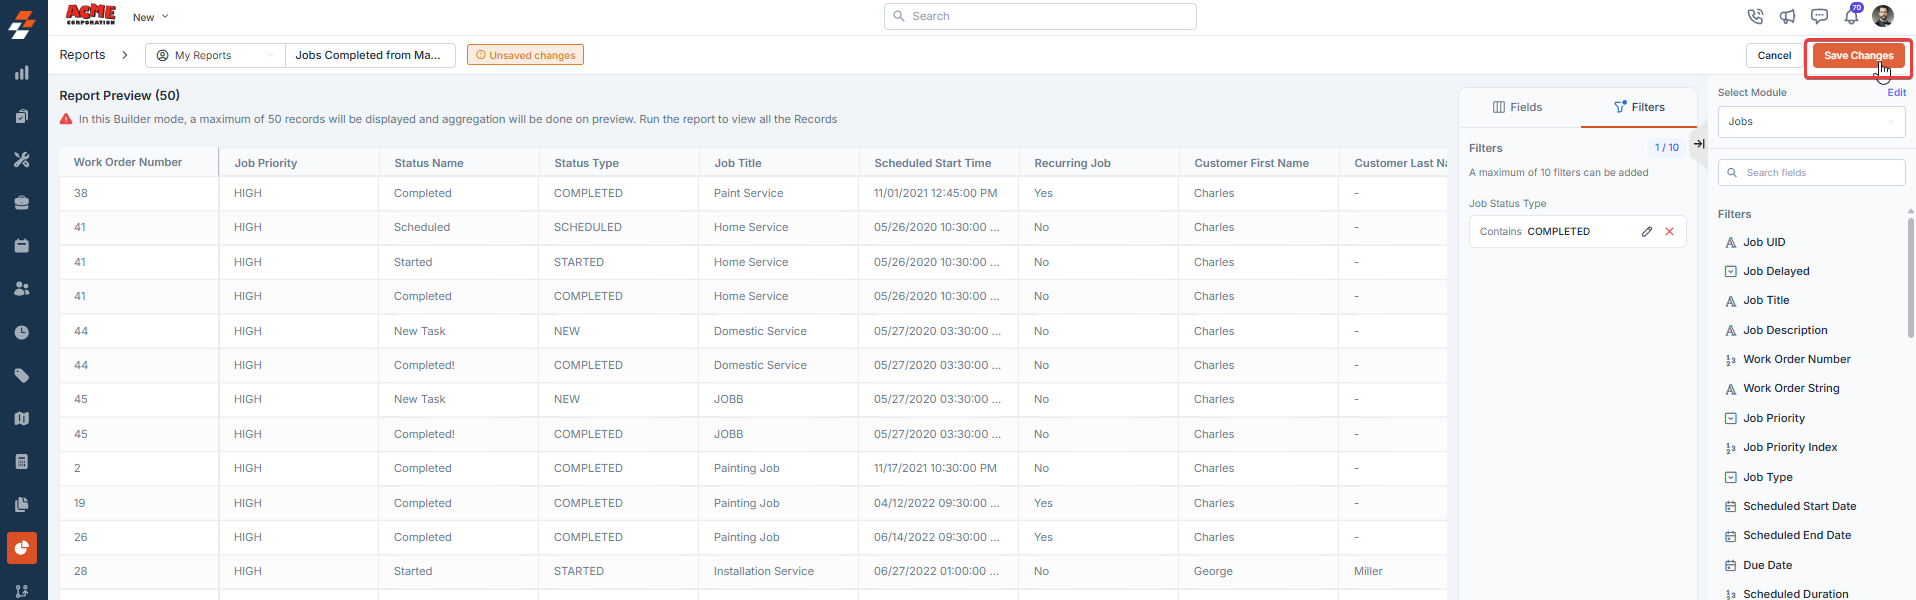
Click Save Changes.
-
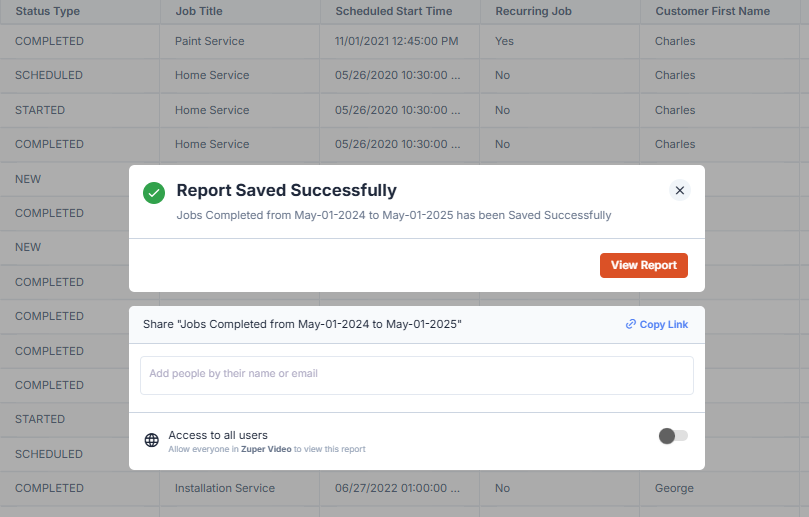
Once the report is created, you can view it by clicking “View Report,” and you can also share it directly with your teams, customers, and so on through email. To share, add people by their name or email address and specify the permissions.
 Note: When generating a Detailed Report, up to 2,000 records can be processed and displayed in the report builder. If you need to access more data, you can download the report, which supports up to 20,000 records in the exported file.
 - You can also decide if you want to schedule this report. For example, you can set this report to generate automatically every week, month, or any custom interval you need. Scheduled reports will be delivered to your inbox or shared with team members according to your preferences. To learn more, see Schedule Report.
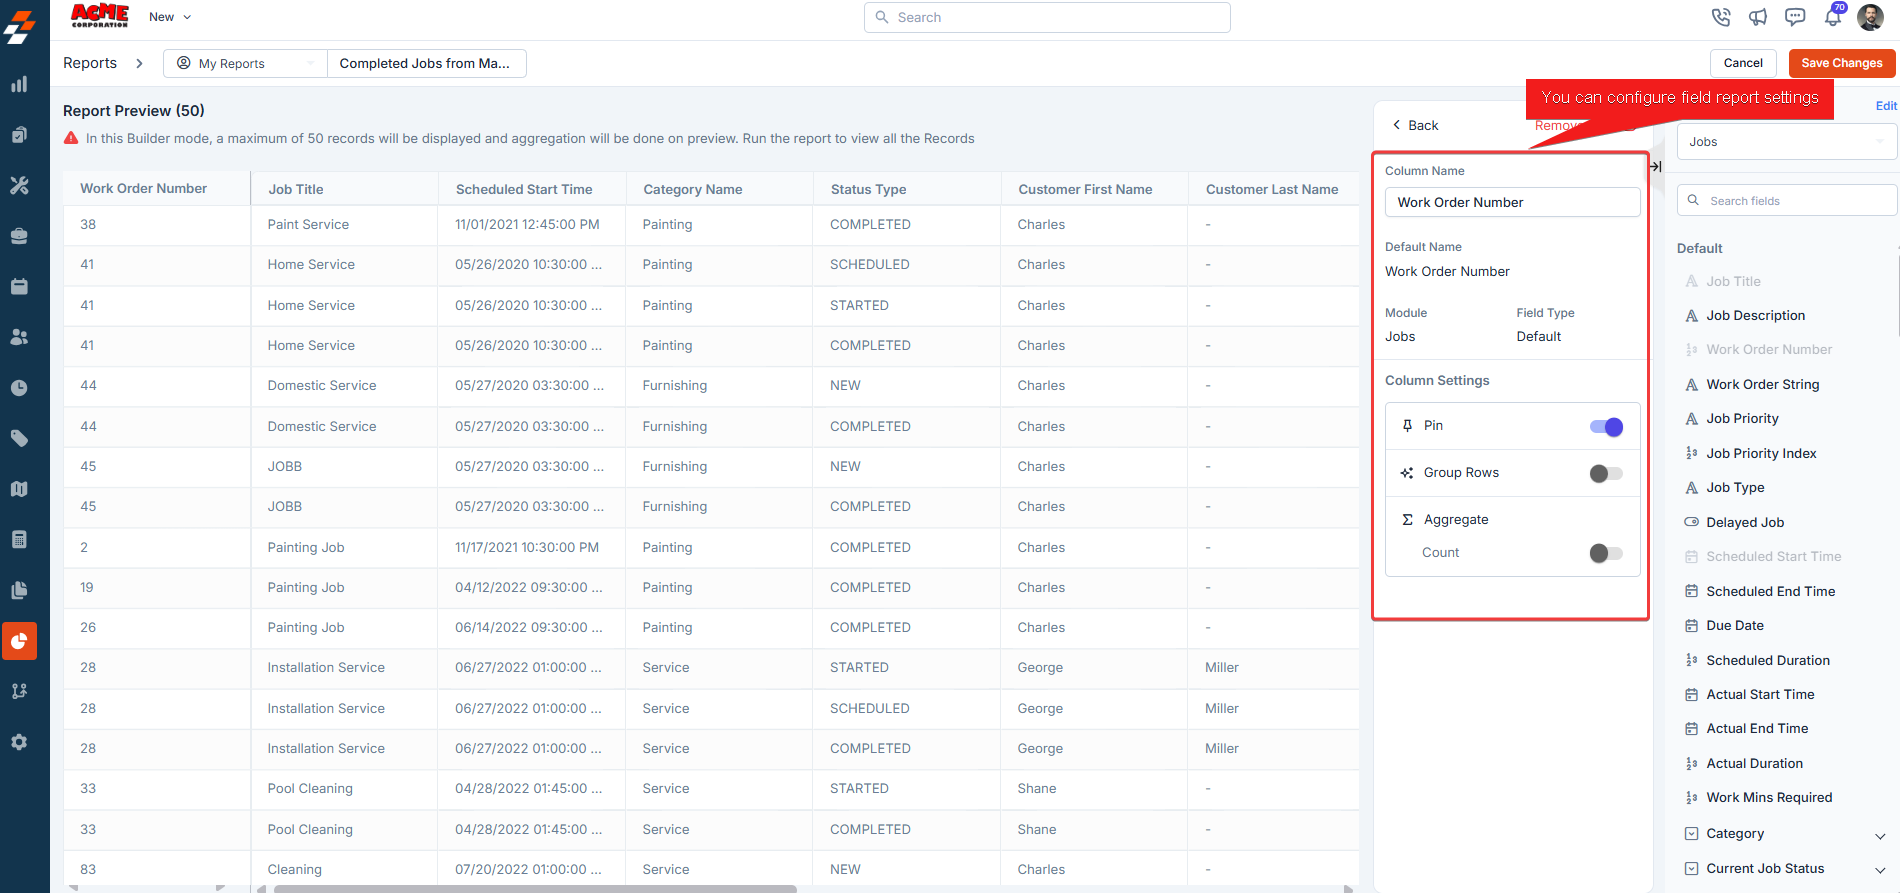
Configure Report Settings
- Field Name: You can change the name for the field (column) that will be displayed in the report (e.g., “Amount”).
- Pin: You can pin a column that allows you to fix it to the left side of the report when scrolling horizontally.
- Group Row: You can group up to 4 rows to organize data based on shared values within that column. When this is enabled, rows with the same value in this column will be grouped together. For example, if you’re generating a report on invoices and want to group them by customer, enabling this for the “Customer Name” column will group all invoices by customer, making the report easier to read.
- Aggregate: This section offers options for summarizing or calculating column values. Based on the column field values, the following fields will be available.
Sum: Adds up all values in the column.
Minimum: Displays the smallest value in the column.
Maximum: Displays the largest value in the column.
Average: Calculates the average value for the column.
Count: Displays the number of entries (rows) in the column.
FAQs
1. Can I change the default name of the report and its location to save? Yes, you can update the report name and its storage location. To do this, click on the default name and edit it as needed. You can also choose the saving location from the drop-down menu.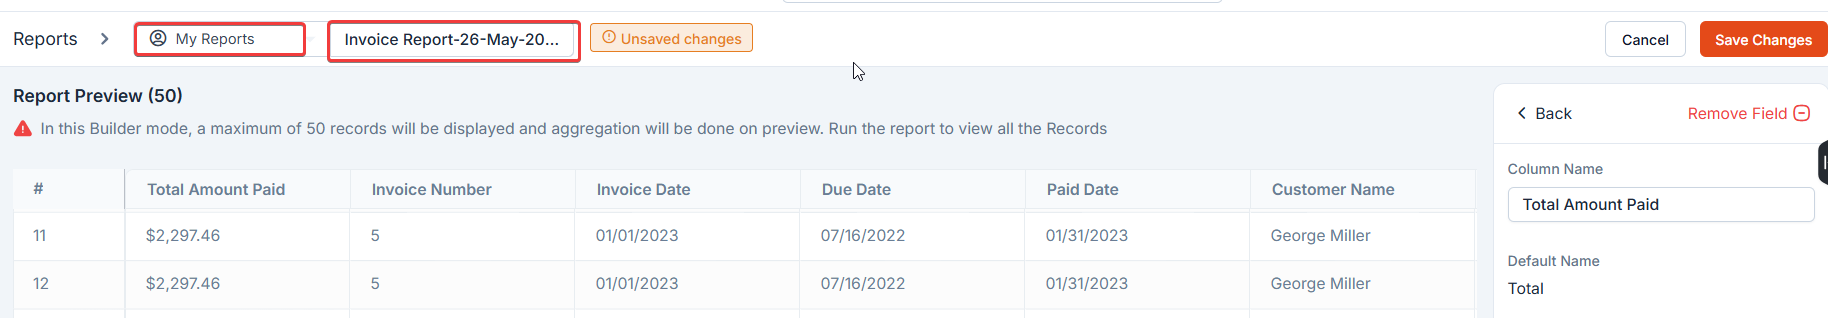
- Detailed Report: Provides in-depth data with multiple columns and filters in tabular form. Use this when you need granular insights, such as transactional records or job logs.
- Summary Report: Offers a high-level view with aggregated data. This report resembles a pivot table, with expandable sections that allow users to drill down into specific details. Choose this when you need quick insights, such as total revenue or average job duration.
- Report Template: A pre-built, standard reports provided for quick use. Use this when you want to start with a ready-made report and optionally you can customize it by editing or adding fields.
- Which modules can I report on?